Written by Bill Yankosky (aka Yodaman)
A Star Wars: Destiny Grand Championship was held Jan. 24-26, 2020 at the Las Vegas Open. Nick Nelson (aka The Gandork) shared a file with the decklists for everyone who played in the event. Following the approach we took with other major events over the past several months, this article will just focus on the decks for players who made the Top 16 at LVO in order to compare similar amounts of data. We will use the diversity formula we defined in a previous article to compare the Top 16 meta at LVO with the top cuts of the previous four major events held in 2019 (Gen Con, Euros, NOVA and Worlds) according to the values computed. As before, we will focus solely on cards in decks (namely downgrades, upgrades, supports and events) and not the characters, battlefields and plots which were used.
DIVERSITY FORMULA RECAP
To recap our thought is that it seems reasonable to think of the maximum number of different cards that could appear in Top Cut decks, which we will call M, via the following formula rather than the number of cards in the entire card pool:
M = Avg. # different cards of a type in deck * # players in Top Cut
For the decks from the Top 16 at LVO, we saw they averaged about 18.625 different cards. Using the above formula, we would expect a maximum of 18.625*16 = 298 different cards to have shown up in those decks. Overall, there are 718 different cards (downgrades, upgrades, supports and events) which can be included in Destiny decks in the Standard format. But our formula tells us it is more reasonable to use the value of M=298, which is about 41.5% of the available card pool when considering diversity.
Using the value M, we then defined the following simple formula to quantify diversity.
Diversity value = Total different cards actually used / M
As mentioned in previous articles, essentially, this simple diversity value represents the proportion of cards that appeared at least once in Top 16 decks from LVO assuming the maximum number of different cards which we would have expected to appear is M=298, rather than the number of different cards available in the entire card pool (which is 718).
A detailed analysis of the decklists from the Top 16 at LVO showed that 126 different cards (i.e. downgrades, upgrades, supports and events) appeared in the 16 decks. Using our simple diversity formula we get
Diversity value overall for LVO Top 16 Decks = 126/298 or about 0.423
The following chart compares the diversity value for the Top Cut at 2019 Gen Con (22 players), Top 16 at 2019 Euros, Top Cut at 2019 NOVA (17 players), Top 16 at 2019 Worlds and the Top 16 at 2020 LVO. Note that the amount of players included for each event was determined entirely by the number of decklists which had been published in their entirety. For Gen Con and NOVA decklists were published for all players who finished 6-2 and made the top cut of those events. For Euros only the Top 16 was published in its entirety. For Worlds, all decklists for everyone who played in the event were published. As mentioned above, for the LVO, all decklists for the Top 32 were actually published.
|
Gen Con |
Euros |
NOVA |
Worlds |
LVO 2020 |
|
| Overall Diversity |
0.291 |
0.334 |
0.421 |
0.3525 |
0.423 |
Using the simple diversity formula, the values indicate that the 2020 LVO Top 16 meta was actually the most diverse Top cut meta of the 5 events, just edging out 2019 NOVA.
TOP 10 LISTS
We’ll break things down two ways for each category. First, we’ll list how many total copies of a card appeared in the LVO Top 16 decks. Second, we’ll list how many of those 16 decks included at least one copy of the card.
We start by looking at the top 10 cards overall (including ties).
Overall Top 10 cards by # copies played in the LVO Top 16 decks (including ties)
- Maximum number of copies that could be played was 32 (2 copies of each card)
| Card |
Total Copies Played |
% Max Copies Played |
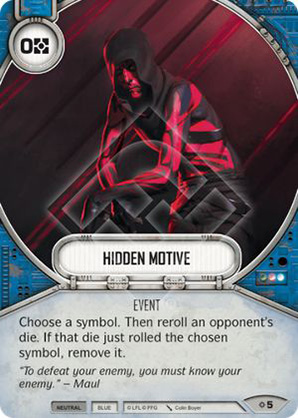
| Hidden Motive |
25 |
78.13% |
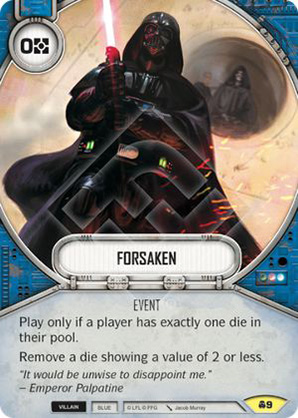
| Forsaken |
16 |
50% |
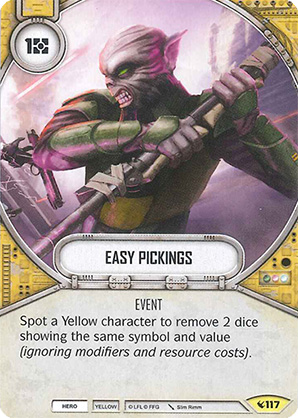
| Easy Pickings |
14 |
43.75% |
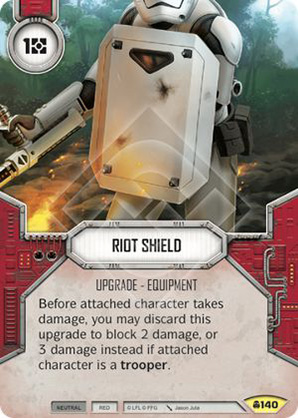
| Riot Shield |
14 |
43.75% |
| Automated Defense |
12 |
37.5% |
| Field Medic |
12 |
37.5% |
| Pacify |
11 |
34.38% |
| Dagger of Mortis |
10 |
31.25% |
| Ewok Ambush |
10 |
31.25% |
| Flee The Scene |
10 |
31.25% |
| Grappling Arm |
10 |
31.25% |
| Niman Mastery |
10 |
31.25% |
| Salvaged Arm |
10 |
31.25% |
For clarification, when we discuss % Max Copies played of a card, we’re assuming that the maximum that could have been played was 32 (2 copies of the card in each of the 16 decks). For Hidden Motive, the most played card, there were 25 copies of it played total out of a maximum possible of 32, which works out to 78.13%. For all five major events analyzed, Hidden Motive was the most widely played card. However, it wasn’t played quite as much at LVO as it had been at Worlds where 31 out of a possible max 32 copies were played and appeared in all 16 of the Top 16 Worlds decks.
Overall Top 10 cards by Number of LVO Top 16 decks card appeared in (including ties)
| Card |
Total Decks Card was In |
% Deck Card Was In |
| Hidden Motive |
13 |
81.25% |
| Dagger of Mortis |
10 |
62.5% |
| Forsaken |
8 |
50% |
| Riot Shield |
8 |
50% |
| Easy Pickings |
7 |
43.75% |
| Ezra Bridger’s Lightsaber |
7 |
43.75% |
| Automated Defense |
6 |
37.5% |
| Entangle |
6 |
37.5% |
| Field Medic |
6 |
37.5% |
| Pacify |
6 |
37.5% |
For clarification, the chart above is listing the number of Top 16 decks that had at least 1 copy of the card in the deck. Some decks may have had 2 copies of the card while others only had 1.
DIGGING DEEPER
In addition to looking at decks as a whole, we can also use the simple diversity formula if we break down the data into smaller categories. Namely, we can look just at downgrades or just at upgrades, etc.. in the LVO Top 16 decks.
DOWNGRADES
For the decks from the Top 16 at LVO, an analysis of the decklists showed they averaged 0.4375 different downgrades. Using the previous formula, we would expect a maximum of 0.4375*16 = 7 different downgrades to have shown up in those decks. Overall, there are 20 different downgrades which can be included in Destiny decks in the Standard format. But our formula tells us it is more reasonable to use the value of 7, which is just 35 % of the available downgrades in the card pool, when considering diversity just for downgrades.
A detailed analysis of the decklists from the LVO Top 16 showed that only 3 downgrades appeared in the 16 decks. Using our simple diversity formula we get
Diversity value for Downgrades for LVO Top 16 decks = 3/7 or 0.429.
The following chart compares the diversity value for downgrades played during the Top Cut at 2019 Gen Con (22 players), Top 16 at 2019 Euros, Top Cut at 2019 NOVA (17 players), Top 16 at 2019 Worlds and Top 16 at 2020 LVO.
|
Gen Con |
Euros |
NOVA |
Worlds |
LVO 2020 |
|
| Downgrade Diversity |
0.333 |
1* |
0.333 |
0.4 |
0.429 |
*there was only 1 downgrade total in all the Top 16 Euro top cut decks. Because of the way the formula works, that meant the downgrades were as diverse as possible. The small sample size is a factor here. But after Euros, LVO had the most diversity in terms of downgrades played.
Downgrades by Number of Copies Played in the LVO Top 16 decks (including ties).
| Downgrades |
Total Copies |
% Max Copies played |
| Mind Extraction |
5 |
15.63% |
| Dead or Alive |
2 |
6.25% |
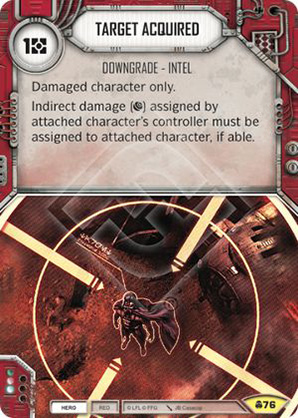
| Target Acquired |
1 |
3.13% |
Downgrades by Number of LVO Top 16 decks card appeared in (including ties).
| Downgrades |
Total Decks Card was In |
% Decks Card Was In |
| Mind Extraction |
5 |
31.25% |
| Dead or Alive |
1 |
6.25% |
| Target Acquired |
1 |
6.25% |
UPGRADES
For the decks from the Top 16 at LVO, an analysis of the decklists showed they averaged about 6.5 different upgrades. Using the previous formula, we would expect a maximum of 6.5*16 = 104 different upgrades to have shown up in those decks. Overall, there are 163 different upgrades which can be included in Destiny decks in the Standard format. But our formula tells us it is more reasonable to use the value of 104, which is about 63.9% of the available upgrades in the card pool, when considering diversity just for upgrades.
A detailed analysis of the decklists from the Top 16 decks at LVO showed that 39 different upgrades appeared in the 16 decks. Using our simple diversity formula we get
Diversity value for Upgrades for LVO Top 16 decks = 39/104 or about 0.375
The chart below compares diversity for upgrades played in the five major events in this analysis. The Top 16 at 2020 LVO was less diverse in terms of upgrades played than almost every other major event.
|
Gen Con |
Euros |
NOVA |
Worlds |
LVO 2020 |
|
| Upgrade Diversity |
0.342 |
0.448 |
0.535 |
0.541 |
0.375 |
The following charts give the top 10 upgrades in terms of # of copies played in total as well as the # of LVO Top 16 decks that included the upgrade.
Top 10 Upgrades by Number of Copies Played in the LVO Top 16 decks (including ties).
| Upgrades |
Total Copies |
% Max Copies played |
| Riot Shield |
14 |
43.75% |
| Dagger of Mortis |
10 |
31.25% |
| Grappling Arm |
10 |
31.25% |
| Niman Mastery |
10 |
31.25% |
| Salvaged Arm |
10 |
31.25% |
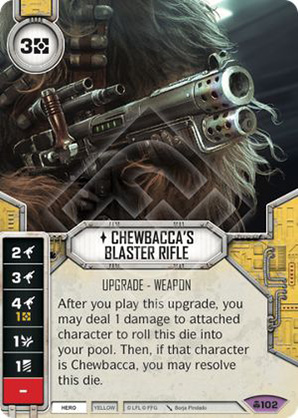
| Chewbacca’s Blaster Rifle |
8 |
25% |
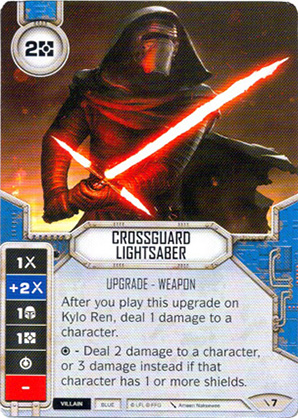
| Crossguard Lightsaber |
8 |
25% |
| Ezra Bridger’s Lightsaber |
7 |
21.88% |
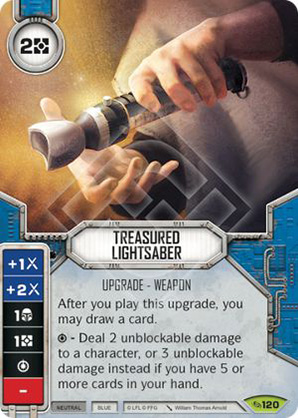
| Treasured Lightsaber |
7 |
21.88% |
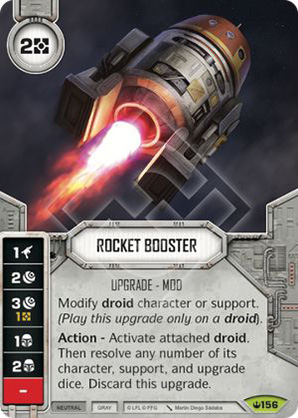
| Rocket Booster |
5 |
15.63% |
Top 10 Upgrades by Number of LVO Top 16 decks card appeared in (including ties).
| Upgrades |
Total Decks Card was In |
% Decks Card Was In |
| Dagger of Mortis |
10 |
62.5% |
| Riot Shield |
8 |
50% |
| Ezra Bridger’s Lightsaber |
7 |
43.75% |
| Chewbacca’s Blaster Rifle |
5 |
31.25% |
| Grappling Arm |
5 |
31.25% |
| Niman Mastery |
5 |
31.25% |
| Salvaged Arm |
5 |
31.25% |
| Crossguard Lightsaber |
4 |
25% |
| Rocket Booster |
4 |
25% |
| Treasured Lightsaber |
4 |
25% |
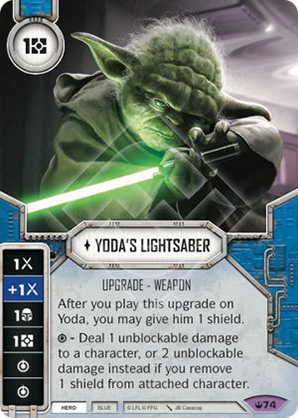
| Yoda’s Lightsaber |
4 |
25% |
SUPPORTS
For the decks from Top 16 at LVO, an analysis of the decklists showed they averaged 1.9375 different supports. Using the previous formula, we would expect a maximum of 1.9375*16 = 31 different supports to have shown up in those decks. Overall, there are 150 different supports which can be included in Destiny decks in the Standard format. But our formula tells us it is more reasonable to use the value of 31, which is about 20.67% of the available supports in the card pool, when considering diversity just for supports.
A detailed analysis of the decklists from the Top 16 decks at LVO showed that 19 different supports appeared in the 16 decks. Using our simple diversity formula we get
Diversity value for Supports at 2020 LVO = 19/31 or about 0.613.
The chart below compares the diversity of supports at the five events. The Top 16 at 2020 LVO was more diverse in terms of supports played than every other major event.
|
Gen Con |
Euros |
NOVA |
Worlds |
LVO 2020 |
|
| Support Diversity |
0.293 |
0.297 |
0.448 |
0.3051 |
0.613 |
The following charts give the top 10 Supports in terms of # of copies played in total, as well as the # of LVO Top 16 decks that included the Support.
Top 10 Supports by Number of Copies Played in the LVO Top 16 decks (including ties).
| Supports |
Total Copies |
% Max Copies played |
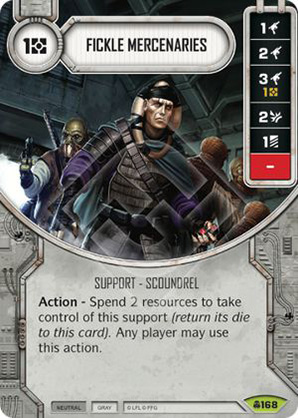
| Fickle Mercenaries |
8 |
25% |
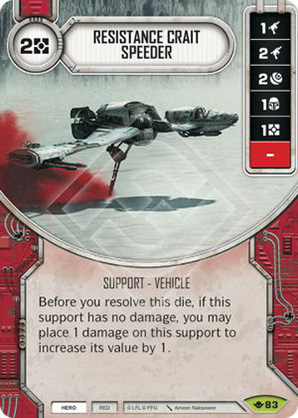
| Resistance Crait Speeder |
6 |
18.75% |
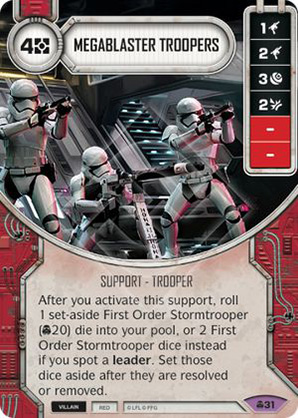
| Megablaster Troopers |
5 |
15.63% |
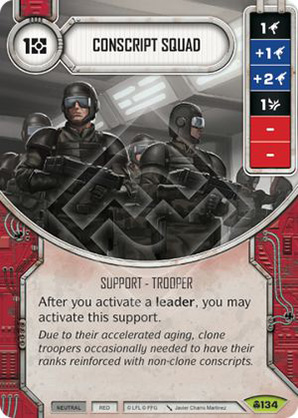
| Conscript Squad |
4 |
12.5% |
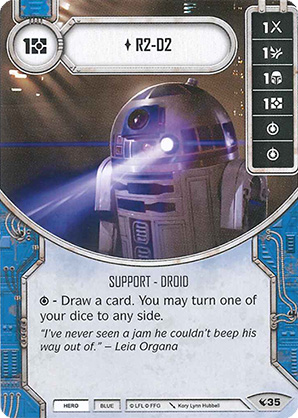
| R2-D2 (Legacies) |
4 |
12.5% |
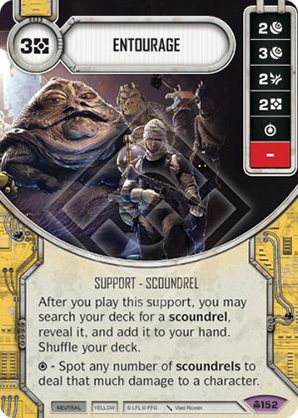
| Entourage |
2 |
6.25% |
| Ground Battalion |
2 |
6.25% |
| Laser Tripwire |
2 |
6.25% |
| Luke’s Protection |
2 |
6.25% |
| On The Mark |
2 |
6.25% |
| Pirate Speeder Tank |
2 |
6.25% |
| Planetary Bombardment |
2 |
6.25% |
| Starviper |
2 |
6.25% |
| Superlaser Siege Cannon |
2 |
6.25% |
Top 10 Supports by Number of LVO Top 16 decks card appeared in (including ties).
*Note every support played ended up showing up in this chart when ties were included.
| Supports |
Total Decks Card was In |
% Decks Card Was In |
| Fickle Mercenaries |
4 |
25% |
| R2-D2 (Legacies) |
4 |
25% |
| Megablaster Troopers |
3 |
18.75% |
| Resistance Crait Speeder |
3 |
18.75% |
| Conscript Squad |
2 |
12.5% |
| Luke’s Protection |
2 |
12.5% |
| BB-8 |
1 |
6.25% |
| Entourage |
1 |
6.25% |
| Ground Battalion |
1 |
6.25% |
| Hired Muscle |
1 |
6.25% |
| Laser Tripwire |
1 |
6.25% |
| On The Mark |
1 |
6.25% |
| Pirate Speeder Tank |
1 |
6.25% |
| Planetary Bombardment |
1 |
6.25% |
| Senate Chamber |
1 |
6.25% |
| Shadowcaster |
1 |
6.25% |
| Starviper |
1 |
6.25% |
| Superlaser Siege Cannon |
1 |
6.25% |
| Vader’s Fist |
1 |
6.25% |
EVENTS
For the Top 16 decks from LVO, an analysis of the decklists showed they averaged about 9.75 different events. Using the previous formula, we would expect a maximum of 9.75*16 = 156 different events to have shown up in those decks. Overall, there are 385 different events which can be included in Destiny decks in the Standard format. But our formula tells us it is more reasonable to use the value of 156, which is about 40.5% of the available events in the card pool when considering diversity just for events.
A detailed analysis of the decklists from the Top 16 decks at LVO showed that 65 different events appeared in the 16 decks. Using our simple diversity formula we get
Diversity value for Events for LVO Top 16 decks= 65/156 or about 0.417
The chart below compares the diversity of supports at the five events. The Top 16 at 2020 LVO was more diverse in terms of events played than every other major event.
|
Gen Con |
Euros |
NOVA |
Worlds |
LVO 2020 |
|
| Event Diversity |
0.276 |
0.306 |
0.366 |
0.2942 |
0.417 |
The following charts give the top 10 Events in terms of # of copies played in total, as well as the # of LVO Top 16 decks that included the Event.
Top 10 Events by Number of Copies Played in the LVO Top 16 decks (including ties).
| Events |
Total Copies |
% Max Copies played |
| Hidden Motive |
25 |
78.13% |
| Forsaken |
16 |
50% |
| Easy Pickings |
14 |
43.75% |
| Automated Defense |
12 |
37.5% |
| Field Medic |
12 |
37.5% |
| Pacify |
11 |
34.38% |
| Ewok Ambush |
10 |
31.25% |
| Flee The Scene |
10 |
31.25% |
| Conflicted |
9 |
28.13% |
| Polarity |
9 |
28.13% |
Top 10 Events by Number of LVO Top 16 decks card appeared in (including ties).
| Events |
Total Decks Card was In |
% Decks Card Was In |
| Hidden Motive |
13 |
81.25% |
| Forsaken |
8 |
50% |
| Easy Pickings |
7 |
43.75% |
| Automated Defense |
6 |
37.5% |
| Entangle |
6 |
37.5% |
| Field Medic |
6 |
37.5% |
| Pacify |
6 |
37.5% |
| Conflicted |
5 |
31.25% |
| Ewok Ambush |
5 |
31.25% |
| Flee The Scene |
5 |
31.25% |
| Instigate |
5 |
31.25% |
| Polarity |
5 |
31.25% |
It is still interesting to take a deeper look at the Top 10 lists of cards played in the Top 16 decks at LVO and to also apply the diversity formula defined in my previous article to top cuts at 2020 LVO, along with 2019 Worlds, Gen Con, Euros, NOVA in order to have one measure that could be used to compare diversity. According to the diversity formula I defined, the 2020 LVO Top 16 decks had the most diversity out of all 5 major events we looked at in 3 of the 5 categories (overall, supports and events). The most recent rules update seemed to have help diversify things for top cuts according to this simple way to measure diversity and that is good to see.
Thanks to everyone who took the time to read this article and look at the data and numbers involved. Thanks again to I Rebel for allowing me to contribute this article.
May the Force Be With You!
